Funcionalidades
Kampal Social creates visualizations of the networks that interest you and, based on them, identifies the most relevant communities and agents according to different criteria of use. You tell us what you want to analyze and Kampal collects, filters, analyzes, quantifies and visualizes the information for you.
Extracción de datos
We work with Twitter as a data source and offer the flexibility to choose which set of tweets to work with.
Choose which keywords, hashtags and users to listen to in your project . You can also exclude certain keywords or users to limit the noise collected and improve the results.
You have the flexibility to add or remove keywords or users to your project at any time. Being able to adjust the information tracking according to the observed results.
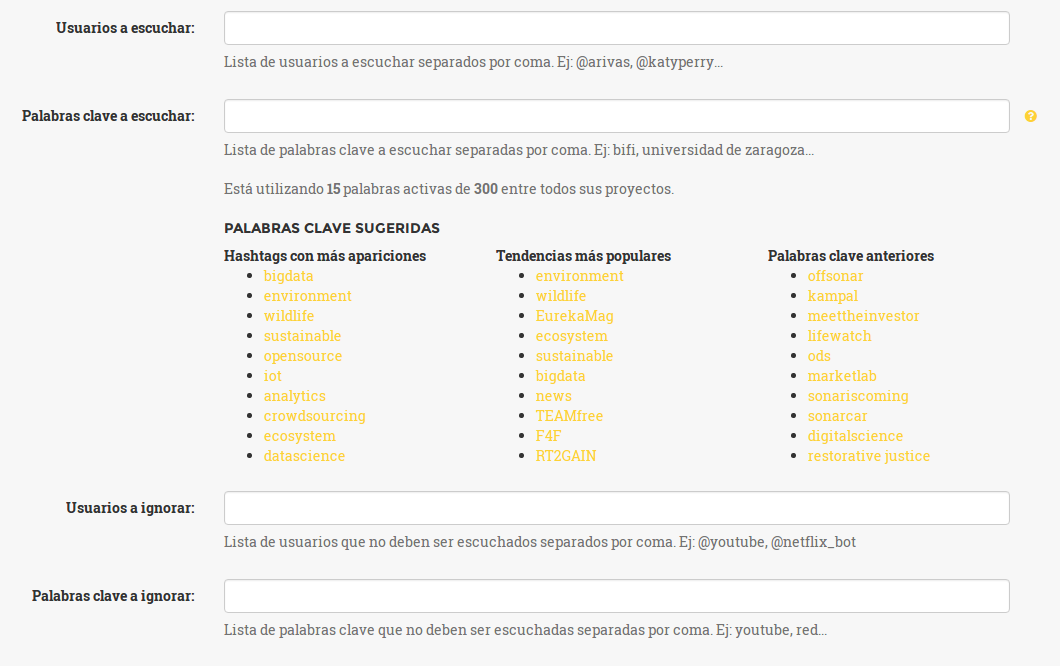
A keyword can be:
- Un #hashtag
- A word of any kind
- A combination of several words. Ex: 'hello world'
The following content is collected from each user :
- Tweets emitidos por el usuario
- Tweets retweeteados por el usuario
- Responses to tweets issued by the user
- Retweets to user-emited tweets
- Tweets that mention the user
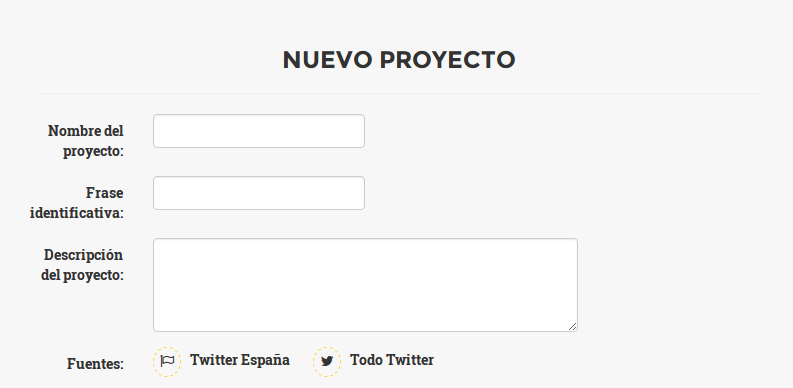
You can choose which data source or sources to use in each project. Regardless of which one you choose, you can still use the filters of hashtags and users.
- Twitter Spain: tweets sent with a location whose coordinates are within the administrative limits of Spain.
- All Twitter: tweets sent from anywhere in the world with or without location.
Mapas de comunidades
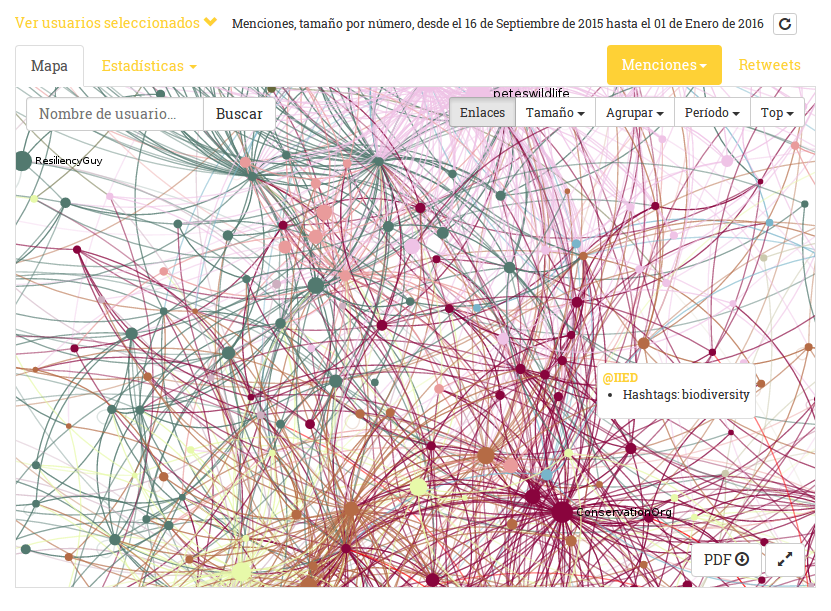
Graphically observe the relationships between users and the communities that form between them based on retweets or mentions sent and received
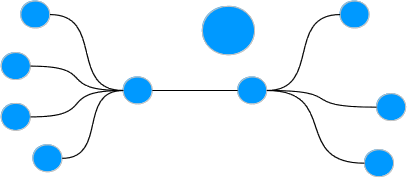
You can see the mapa de comunidades from all collected tweets , the top 1000 map, or one or more individual users maps.
Adjust the map according to your needs through filters, groupings, date ranges, etc. Browse through it to visualize the relationships with other users graphically
You can also export the results in PDF format.
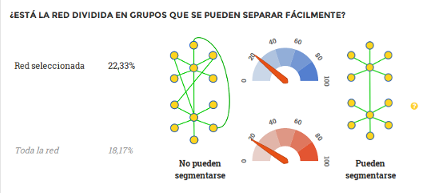
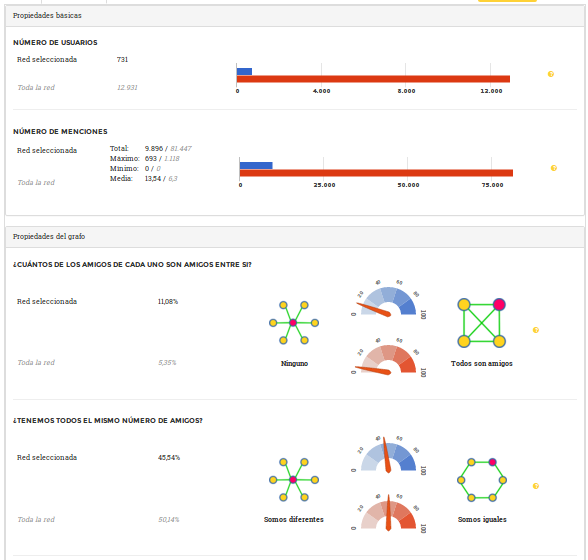
Analyze the most relevant properties of the selected user network. You can compare the network of a set of users against the network of all the tweets collected in your project.
It checks the cohesion of the network users and what kind of relationships exist between them, or if the network is divided into groups that can be easily segmented or not.
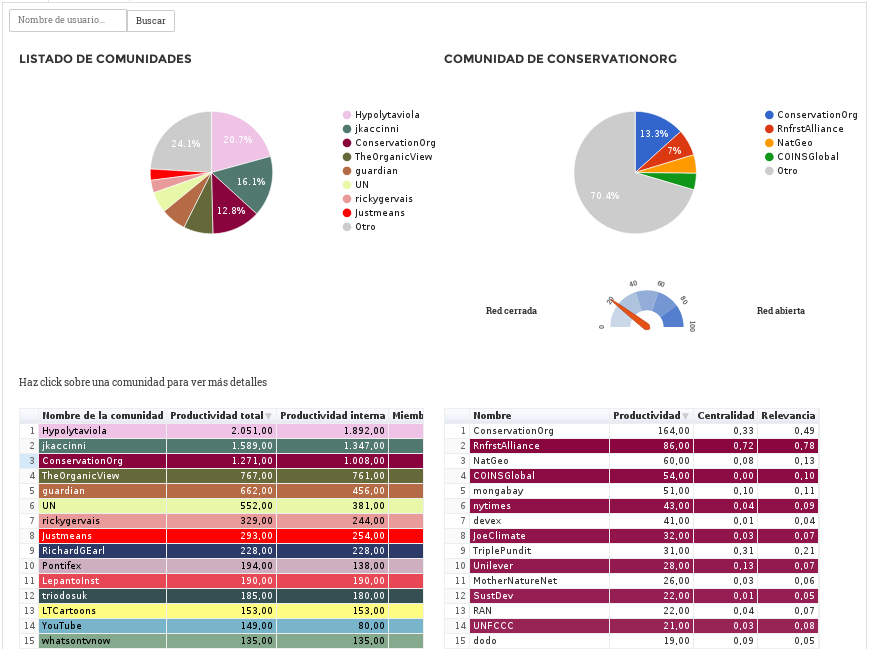
Find the most active communities and the users that form them.
Compares quantitatively some communities with others and detects emerging, remarkable, irrelevant communities, etc.
Mediante el análisis de comunidades puedes observar qué usuarios son los más interesantes para tu proyecto y cuales sólo aportan ruido para poder filtrarlos.
Métricas e indicadores
By analyzing communities you can see which users are the most interesting for your project and which only add noise to be able to filter them.
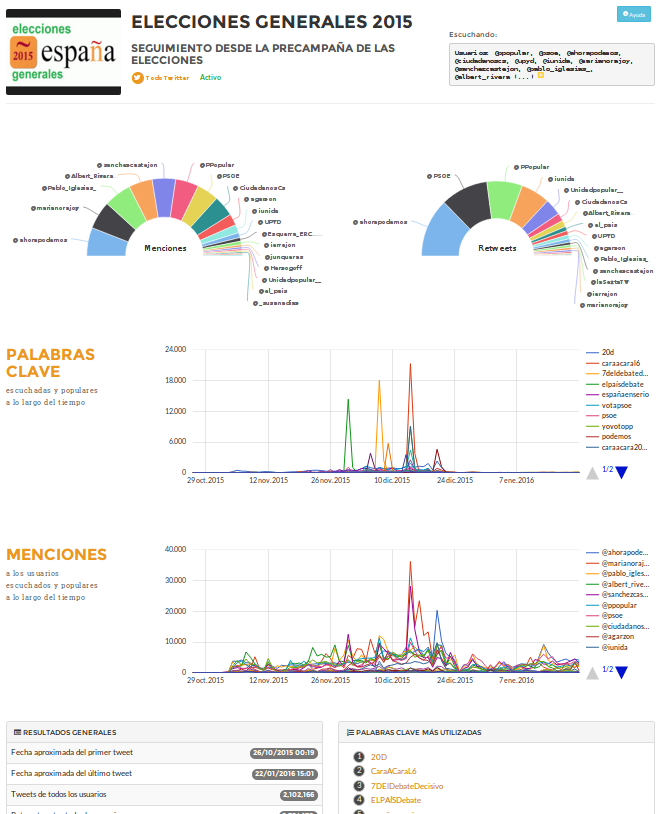
By the infografías generadas automáticamente puedes ver de un primer vistazo las métricas más importantes de tu proyecto:
- Usuarios más menciones y más retweeteados (top 20 de usuarios)
- Evolución temporal de las palabras clave escuchadas
- Evolución temporal de las menciones realizadas a los usuarios escuchados
- Información general del proyecto como el número de tweets, usuarios, menciones o retweets recogidos, la fecha del primer y último tweet, etc.
- Mapa de comunidades del top 1000 de usuarios y mapa de los usuarios líderes de cada comunidad
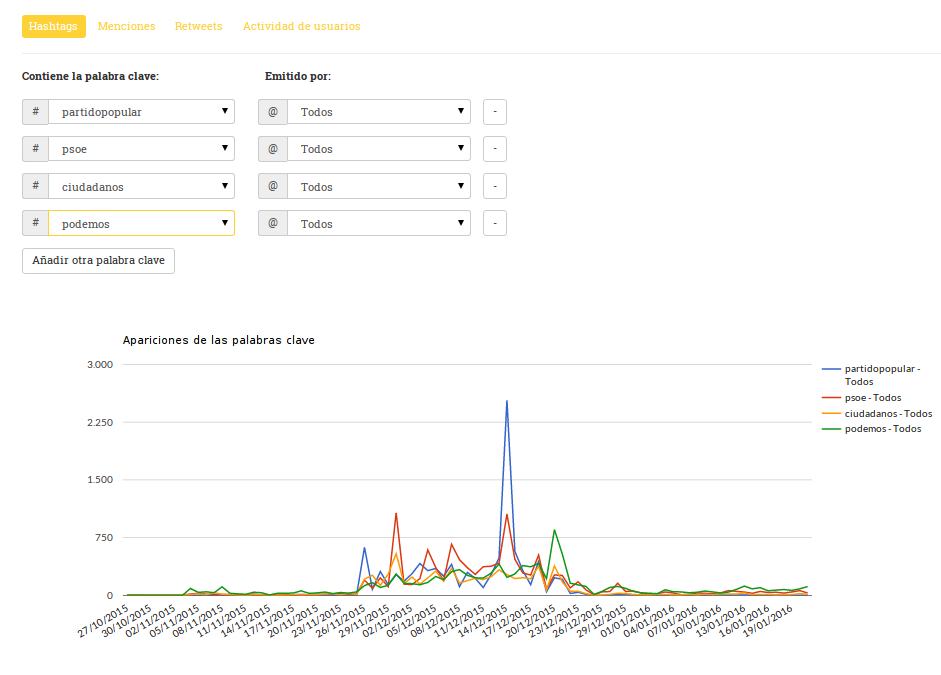
Mide como ha evolucionado desde el inicio del proyecto el uso de una palabra clave o un hashtag, las menciones a un usuario, la actividad de un usuario, etc.
Kampal Social te permite filtrar por entidad (palabra clave, usuario mencionado, usuario retweeteado) y emisor del tweet que contiene la entidad.
Puedes visuailzar simultaneamente varias combinaciones para poder comparar usuarios o palabras clave.
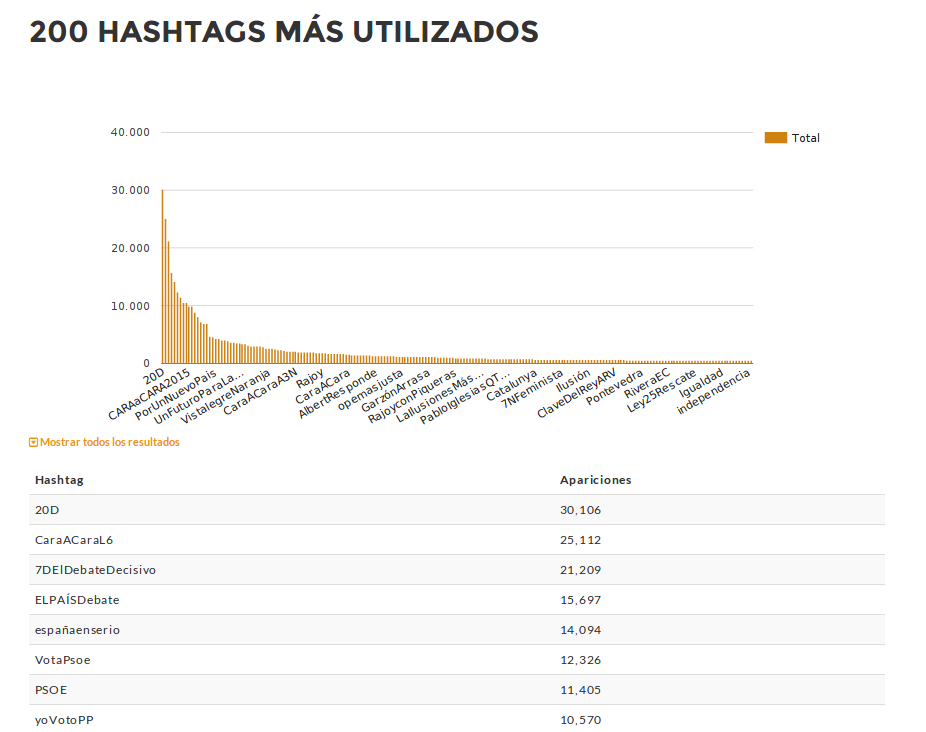
Los rankings te permiten comprobar qué usuarios, palabras clave y tweets són los más relevantes de tu proyecto.
Ofrecemos lo siguiente:
- Palabras clave más utilizadas
- Usuarios más activos
- Usuarios más mencionados
- Usuarios más retweeteados
- Hashtags used by most active users
- Tweets más retweeteados
Heat maps
Mediante Kampal Social puedes observar qué zonas son las más activas dentro de tu proyecto y qué es lo que más se habla en cada zona
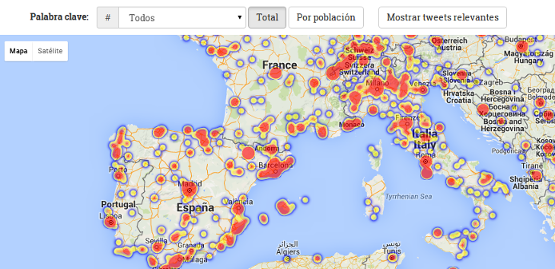
Utiliza los mapas de calor para localizar aquellos lugares donde las palabras o usuarios escogidos en tu proyecto son más activos o filtra los resultados para obtener información de una palabra clave de las escuchadas.
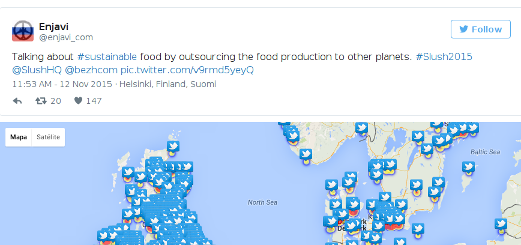
Y comprueba cuales son los tweets más relevantes de cada zona.
Y todavía más
| Analysis of the absolute positive and negative sentiment and around users | |
| Control de visibilidad de tu proyecto. Hazlo visible sólo para quien tu quieras | |
| Personalización de las imágenes y logos de los PDFs | |
| Controla en todo momento el número de documentos descargados y cuánto queda para llegar al límite |